


The arithmetic is usually shorter than the setup. The difficult part is deciding what can happen, which money is already in the pot, and how often each branch occurs. A precise formula with an unsupported calling range can still give the wrong answer. Treat the output as conditional: “This call earns $10 on average if the stated range gives me 30% equity,” not “This call earns $10.”
What Expected Value Means
EV describes an average, not the result you must receive in one hand. A sound decision can lose, and a bad decision can win. GTO Wizard's EV overview separates money gained at showdown from value gained when opponents fold. Both can contribute to the average of an action.

The Poker Bank uses a fair coin and net payoffs of +$3 and −$1 to explain expected value in English, with English captions. The +$1 average is not a promise about the next outcome; the poker models below require their own probabilities and costs.
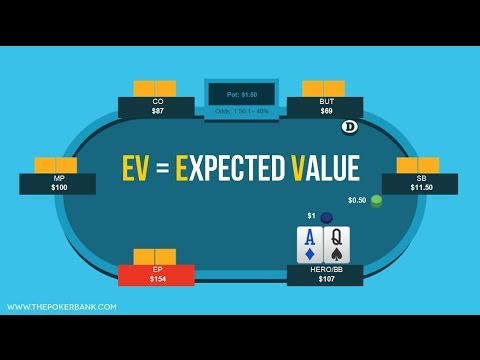
Suppose an original model returns +$8. You may never see an outcome of exactly +$8. The hand might win $120 or lose $40, with those outcomes combining to an $8 average. That is not a contradiction. It means the expected value is a weighted summary of possible results rather than one of the results on the tree.
EV also does not certify your assumptions. If a model says an opponent folds 40% of the time, the formula uses that input; it does not verify it. Record estimated frequencies separately from known pot and stack amounts. The distinction tells you where another minute of research or hand review can actually improve the calculation.
Choose a Reference Point and Unit
For every example below, the reference point is the instant before Hero makes the decision being evaluated. Money already in the pot is sunk: it is no longer part of Hero's remaining stack. Folding has an incremental EV of zero from that point. This does not mean that folding returns earlier contributions, or that the entire hand broke even.
Suppose Hero previously put in $20 and now faces a decision with EV +$10 from the current point. Measured from before that earlier contribution, the same modeled line has EV −$10: −$20 + $10. Folding now would be −$20 from that earlier baseline, so continuing still improves the expectation by $10. Shifting a common baseline changes the displayed levels, not the ranking of the actions.

Choose one unit as well: dollars for a cash example, chips for a tournament chip model, or big blinds for a normalized hand review. Convert every amount before adding it. A result of 0.4 bb and a result of $2 are not directly comparable without the blind value. A percentage is not an EV unit unless you explicitly define what amount it represents.
Build an Outcome Table
A complete table needs mutually exclusive outcomes whose probabilities add to 1. “Opponent calls” and “Hero wins” are not separate final outcomes because both can happen together. Split the call branch into call-and-win, call-and-tie, and call-and-lose as needed. Alternatively, calculate the conditional EV of the call branch first, then weight that whole branch by the probability of getting called.
Use net results consistently. If the pot before your $50 bet is $100 and the opponent calls another $50, winning returns $200 in total, but $50 of that is your own new bet. Your net gain from the decision point is $150. Losing costs your $50. If the opponent folds, your uncalled $50 returns to you, so your net gain is the old $100 pot, not $150.
The general equation is EV(action) = Σ probability(outcome) × net result(outcome). An equivalent gross-receipt method is expected money returned minus your new investment, provided the investment and return are defined for each branch. Choose either method and keep it throughout a table. Mixing a gross win value with a net loss value without accounting for the stake is a common way to overstate EV.
Calculate the EV of a Call
The shared worksheet uses a $100 starting pot and a possible $50 bet. All examples are original river toy models: one opponent, no ties, no future betting after a call, no rake unless added explicitly, and enough effective stack to cover the action. The range gives Hero 30% showdown equity before any selection by a bet response. These percentages are assumed inputs, not measured population tendencies.

In the call/fold version, the opponent bets $50 into the $100 pot and Hero's equity against that betting range is stipulated to remain 30%. The pot before Hero calls is now $150; the call costs $50; the final pot is $200. If Hero wins, the incremental net result is +$150. If Hero loses, it is −$50.
| Action and Outcome | Probability | Net Result From Decision | Contribution to EV |
|---|---|---|---|
| Call and Win | 0.30 | +$150 | +$45 |
| Call and Lose | 0.70 | −$50 | −$35 |
| Total for Call | 1.00 | — | +$10 |
| Fold | 1.00 | $0 | $0 |
Therefore EV(call) = 0.30 × $150 − 0.70 × $50 = +$10. The gross-receipt check is 0.30 × $200 − $50 = +$10. The forms agree. Do not add the old pot once more or subtract the $50 call again after using the net-outcome table.
Break-even equity follows from the same equation. Set q × $200 − $50 = 0, giving q = 25%. At exactly 25%, calling and folding have equal incremental EV in this simplified model. At 30%, calling is $10 better than folding. The pot odds guide develops this price comparison; EV makes the gains and losses explicit.

Calculate a Bet With Fold and Call Branches
Now use the bet/check version of the worksheet. The pot is still $100, but the opponent checks to Hero instead of betting. If Hero checks, the hand reaches showdown immediately, with no further bet from either player. Checking therefore earns 0.30 × $100 = $30 from this point. That is positive because the current pot is available to win without any new investment.
If Hero bets $50, assume the opponent folds 40% and calls 60%, never raising. Hero's equity against the calling range is 20%, not the original 30% against the entire range. The call-and-win probability is 0.60 × 0.20 = 0.12; call-and-lose is 0.60 × 0.80 = 0.48. Together with 0.40 folds, the final probabilities add to 1.
| Final Outcome After $50 Bet | Probability | Net Result | Weighted Contribution |
|---|---|---|---|
| Opponent Folds | 0.40 | +$100 | +$40 |
| Opponent Calls, Hero Wins | 0.12 | +$150 | +$18 |
| Opponent Calls, Hero Loses | 0.48 | −$50 | −$24 |
| Total | 1.00 | — | +$34 |
The same calculation can keep the called branch together: EV(bet) = fP + (1 − f)[e(P + B) − (1 − e)B], where P is the pot before Hero bets, B is Hero's bet, f is the fold probability, and e is equity conditional on a call. Here it is 0.40 × $100 + 0.60[0.20 × $150 − 0.80 × $50] = $34.
For a consistency check, imagine 100 weighted range units before the bet. Hero beats 30 units and loses to 70. The opponent folds 40 units: 18 that Hero beats and 22 that beat Hero. The opponent calls the remaining 60: 12 that Hero beats and 48 that beat Hero. Hero wins 12/60 = 20% when called, while still winning 30/100 = 30% if everything checks through. This is a possible joint model, not a claim that an opponent literally has 100 equally likely card combinations.

Compare Actions, Not Just Positive Numbers
A +EV action is not automatically the best available action. Compare alternatives from the same node, in the same unit, using the same baseline. SplitSuit's “+EV vs. Optimal” and “Comparing +EV Lines” make this distinction explicit. An action can earn money relative to folding and still give up value relative to checking or using another size.
In the original bet/check model, the $50 bet earns $34, while checking earns $30. The bet gains $4 relative to checking, not $34. That $4 is the relevant margin if these are the only two actions being compared. If the fold or calling-range estimate is uncertain enough to move the result by more than $4, the ranking is not robust.
Add a hypothetical $25 bet. Suppose this size gets 30% folds and leaves Hero 25% equity when called. These inputs are consistent with the same 30% checkdown equity: among 70 calling units, Hero beats 17.5; among 30 folding units, Hero beats 12.5. The bet EV is 0.30 × $100 + 0.70[0.25 × $125 − 0.75 × $25] = $38.75. Both bets are +EV, but the smaller bet earns $4.75 more under these particular response assumptions.
| River Action in the Shared $100-Pot Model | Assumed Fold Rate | Equity When Called | Incremental EV |
|---|---|---|---|
| Check to Immediate Showdown | Not Applicable | 30% vs. Whole Range | $30.00 |
| Bet $25 | 30% | 25% | $38.75 |
| Bet $50 | 40% | 20% | $34.00 |
This table does not establish that smaller bets are generally better. Bet size changes what an opponent folds, calls, or raises. The model explicitly changes those responses instead of assuming a larger bet buys the same range at a higher price. To evaluate a real hand, substitute a defensible response model for each size and include raises if they are possible.
Rake, Future Betting, and Model Uncertainty
Rake is a cost, not a universal fixed percentage that can be pasted onto every game. For an arithmetic sensitivity test only, suppose a hypothetical rule removes exactly $4 from any showdown pot and removes nothing when a player folds. This is not a statement about a poker room's fee schedule. The call's gross-receipt equation becomes q × ($200 − $4) − $50.
| Equity Assumption for the Call | EV Without Rake | EV With Hypothetical $4 Showdown Deduction |
|---|---|---|
| 25% | $0.00 | −$1.00 |
| 30% | +$10.00 | +$8.80 |
| 35% | +$20.00 | +$18.60 |
In the $50-bet model, that same hypothetical deduction changes EV from $34 to $33.52: 0.40 × $100 + 0.60[0.20 × $196 − $50]. The cost only appears when the pot reaches showdown, and only the share returned to Hero enters Hero's expectation. Subtracting $4 from every branch would use a different fee model.
Future betting needs explicit branches too. A turn call may lead to a river fold, a checked-down win, another losing call, or an extra value bet when a draw hits. Replacing all of those paths with raw showdown equity assumes that no such differences matter. If the tree becomes too large, narrow the question to one street or label a simplified model rather than pretending that an omitted branch is worth zero.

It is often more useful to calculate the threshold than to debate one point estimate. In the no-rake call, you need 25% equity. In the hypothetical-rake version, you need $50/$196 = 25.51%. If plausible range estimates lie on both sides, write down the decision as range-sensitive. Reporting an EV of +$0.17 without that context can suggest much more certainty than the inputs justify.
Chip EV vs. Tournament Money EV
Tournament chip EV and expected prize money are not interchangeable. Payouts and stack distribution can change the money value of a chip decision; SplitSuit's section on tournament EV mistakes specifically flags the ICM boundary. A calculation in chips should remain labeled chip EV until a stated payout model converts terminal stacks into money values.
The EV method itself does not change. Instead of giving each final outcome a net chip result, assign it the appropriate expected-prize value from the same tournament model, then probability-weight those values. Do not multiply chip EV by one constant dollar-per-chip rate unless that conversion is actually part of the model. Bounties or other awards also require their own cash-flow branches when relevant.
Keep the scope narrow when you do not have the full tournament inputs. “This shove is +200 chips in the simplified model” can be a valid intermediate result. “This shove increases my expected payout” is a different conclusion and requires more evidence. The independent chip model guide owns that additional conversion rather than hiding it inside a generic EV formula.
A Reusable EV Worksheet
Use this sequence for a post-session review. Record the decision node and legal actions; choose the baseline and unit; reconstruct the current pot and remaining effective stacks; list the range and response assumptions; draw all relevant branches; and give each terminal outcome a net result. Only then multiply probabilities by results. The hand-review guide helps reconstruct the information available at the time.
Before accepting the arithmetic, verify that final branch probabilities sum to 100%, no new investment is charged twice, ties return the correct share, and the old pot is not counted as a new cost. Recalculate one example with both net-outcome and gross-receipt methods. If the totals differ, resolve the bookkeeping before discussing strategy.
Finish with the assumption that most threatens the ranking. That may be a calling range, a fold frequency, an extra river payment, or a tournament conversion. Change it within a defensible interval and compare the actions again. A useful EV review ends with a conditional conclusion you can explain, not just a positive number you can quote.
Sources and Calculation Notes
- The PokerBank — “Expected Value”, “What Is Expected Value?” and “How to Work Out Expected Value.” Supports the weighted-average definition and comparison of actions. No publisher date was visible. Checked October 28, 2026.
- GTO Wizard — “What Is Expected Value in Poker?” (June 1, 2022), “Overview” and “Where Does EV Come From?” Supports the action-value concept and distinction between showdown and fold contributions. Checked October 28, 2026.
- SplitSuit — “Poker Expected Value (EV) Formula”, “+EV vs. Optimal,” “Comparing +EV Lines,” and “Misapplying EV in Tournaments.” Supports comparing alternatives and keeping tournament money EV separate from chip EV. The page title includes 2026, but no publication date was visible in the article body. Checked October 28, 2026.
All tables, response frequencies, weighted range units, rake sensitivity, and monetary results here are original hypothetical calculations. The $4 deduction is a deliberately stated teaching assumption, not a room's real rake. No example reports solver output or measured opponent behavior.
About the Editorial Team
The Poker-Eye Editorial Team researches, checks, and maintains product and educational content. Sources and product boundaries are reviewed before publication.